What are infographics?
Infographics contain essential information or data presented through graphics that make it easy for shoppers to quickly understand your product’s necessary information. Put simply; Infographics help comprehension and retention of information. They are designed to reach a much wider audience by simplifying complex subjects and arranging them into an easily digestible form.
How do they help in conversion?
Infographics can generate sales and conversions that help your business grow. It is proven that infographics can have a more significant impact on the landing page when it comes to sites like amazon. They are visually appealing and provide the necessary information in an easily understandable way.
It is already known that People like to flip through images first before they read the sales copy. With the help of the infographics, you can catch the attention of those people in the first few seconds, which translates to them staying on your page for longer and ultimately help in conversion. However, to create compelling infographics, there are specific steps that you need to follow.
Step 1: Do you Market Research
Before you can begin creating infographics, you need to do your market research. Market research is crucial as it can help you find what keywords you need to target. Luckily, Amazon itself is a great place to conduct your market research, which is excellent, especially if you are a small business owner or do not have a huge budget to begin with. Simply following these steps should provide you with enough information to help you decide what you need to focus on.
1. Read all the positive and negative reviews of your competitors
Looking at your competitors’ reviews can give you great insight into your potential customers. Focus on the language that is being used by the customers. Look for something in common that is being talked about. It could be an issue that they have with the product or something they like about the product. However, a tip to keep in mind would be to focus more on the ones that lie in the middle range, so 3 to 4 stars as those are usually the most honest. Reading those reviews can be useful as you can find out words that you need to target.
2. Go through the Commonly asked questions on the competitors listings
Another great way to collect information about what the potential customers are talking about or interested in when considering buying a product. Just look at the commonly asked questions. They can provide valuable insight into information that the buyers are interested in knowing about. Once you figure out what information your potential customers are looking for, you can use it in your listing images.
3. Find the Unique selling point
Since you will already be on your competitors’ listings, you can figure out how your product differs from what is already on the market. Figuring out how your product stands out from the rest of the competition can prove significant. It could be its colour, its shape or that it is eco-friendly. The thing that makes your product unique or better than what is currently on the market. Highlighting this unique selling point could help in providing you with a much-needed edge over the competition.
STEP 2: Decide what to include in your Infographics
After you have successfully collected all the necessary information, the next step will be to select which information to showcase on the infographics to maximize the outcome.
1. Showcase your product features
One thing you can do to make a useful infographic for your product is to showcase your product features. The features will include your product appearance, components, and capabilities.
They are essential because they can help convince a buyer to purchase your product. The image attached above exactly does that. The image includes the appearance of the product as well as the component and two of its capabilities. Furthermore, the included text solidifies what is already being shown.
2. showcase your product benefits
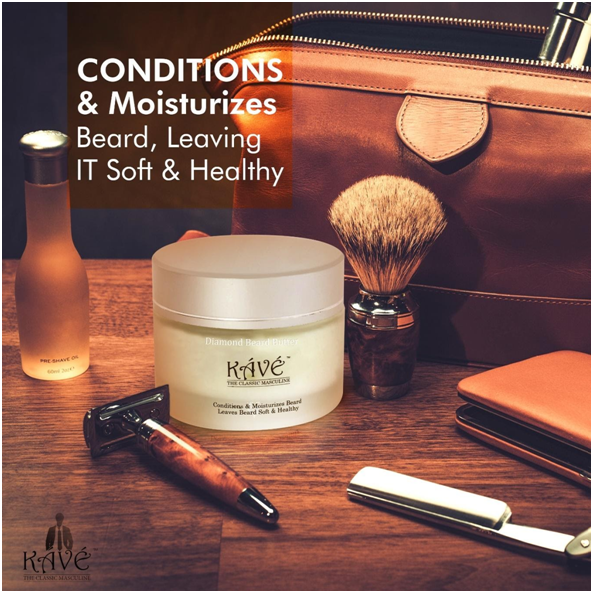
Image Created By AMZ One Step.
Another great idea is to include benefits. The benefits are all the things that tell the buyer why they should buy your product and what change in their lifestyle your product can bring. Take the example of the image attached above. The text includes the product’s intended purpose and how it can be positive for anyone who uses it. Therefore, by reading what is written, the person can easily understand what is being conveyed here. If they are interested in having the same results, they will be more inclined to buy the product.
3. Include your product dimensions /size
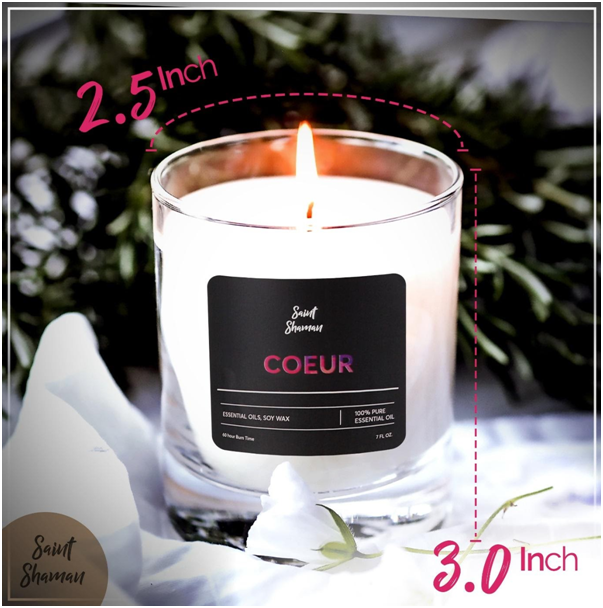
Image Created By AMZ One Step.
Including an infographic of your product dimension is one of the best things you can do for your business. How? Because it will help in reducing the returns and negative reviews. Often, people are unhappy with their product because they did not notice or forgot to read the product size and dimension. By including the product dimension in your infographics, you will essentially reduce that from happening, translating to lesser returns.
4. Include how to use directions / ingredients
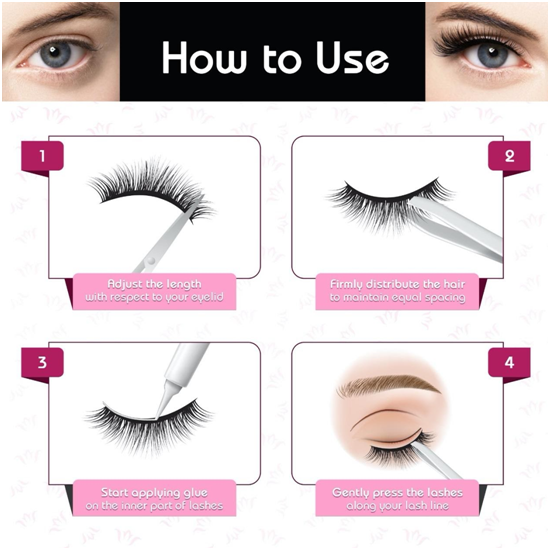
Image Created By AMZ One Step.
Even if your product is relatively simple to use, it is never a bad idea to include steps and directions on using it. Similarly, it goes for ingredients by showcasing the main components and their benefits; you can help ease the buyer’s anxiety. Including directions or ingredients can help make buyers feel confident and help them in making their decision.
Some of the best practices for infographics
Following are some of the things that you need to be mindful of when creating infographics:
Make sure your text is short & conveys a clear message to the buyer: The whole point of infographics is to provide essential information precisely. If your text is long, it might not be as effective.
Ensure you are not using any false claims: Making false claims can lead to bad reviews and unsatisfied customers. Always make sure you are backing up the claim you are making.
Make sure your text is relevant to lifestyle images: Since you are not using a lot of text, make sure the text you use is appropriate. To make sure that is the case, use images that help you showcase the point you are trying to make; otherwise, it would not be effective.
Make sure your infographic is blended with your brand: Your font style and colour should align with your brand’s theme, logo, and colour. The colours you choose will help convey emotion, feelings, and experiences, which will help your brand’s good identity.
If you follow these simple steps, you too can create infographic photos that will convert more. If you are also interested in knowing about Amazon Product Photography. If you are looking to outsource your product images.
Author Bio
Aashirvad Kumar is a SEO Executive at Optimize For SEO. He has been blogging since 2016 in the technology niche. He has experience of more than 5+ years in Digital Marketing.


